
Mailing report
A report for any mass messaging can be viewed on the page with mailings list in the corresponding section: Email mass messaging, SMS mass messaging, Push mass messaging.
To view the desired report, go to the My mass messages block, select the desired mailing, and click Stats. The report includes the following sections:
- Mailing volume;
- Purchases;
- Groups report;
- Mailing efficiency;
- Product sales (limited access);
- Heatmap.
The report can be generated for a specific period. To do this, click the calendar icon on the top right panel and set the desired date range for the report. | 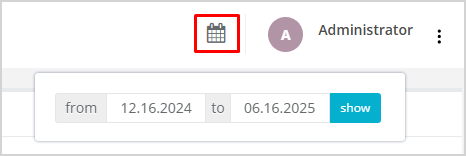 |
Mailing volume
This section is displayed only for mailings with the status Sent. It provides statistics based on the following metrics:
- Good recipients — customers who should receive the mailing.
- Address issue — customers with missing or incorrect contact details.
- Unsubscribed from communication channel — customers who opted out and will not receive the mailing.
- Unsubscribed from mailing category — customers who opted out the specific mailing category and will not receive the mailing.
- Blocked by communication policy — customers who do not receive mailings due to rules of the configured communication policy.
- Actual recipients — number of customers who received the message.
 |
Orders placed
The Orders placed section shows the number of receipts/orders placed and sales volume associated with the mailing. To see exact data for a specific day, point the mouse to the data point on the graph.
Groups report
This report allows to analyze the results of the mailing across groups when:
- Control group has been assigned to the mailing.
- A/B testing has been implemented within the mailing.
Email open rate
The Email open rate chart is available for reports on email mass messaging and campaign reports. The chart helps to analyze at what time of the day recipients most actively open emails. This allows to better plan future mailings and choose optimal time for sending new emails to increase the likelihood of messages being read. Additionally, this chart can help adjust sending times for different regions if the Company operates in multiple time zones.
Mailing efficiency
Based on the collected data, a chart is generated showing how effective the mailing was. You can view:
- Number of messages sent;
- Number of messages delivered;
- Number of messages opened;
- Number of clicks on links to open the website;
- Number of receipts/orders placed as a result of the mailing.
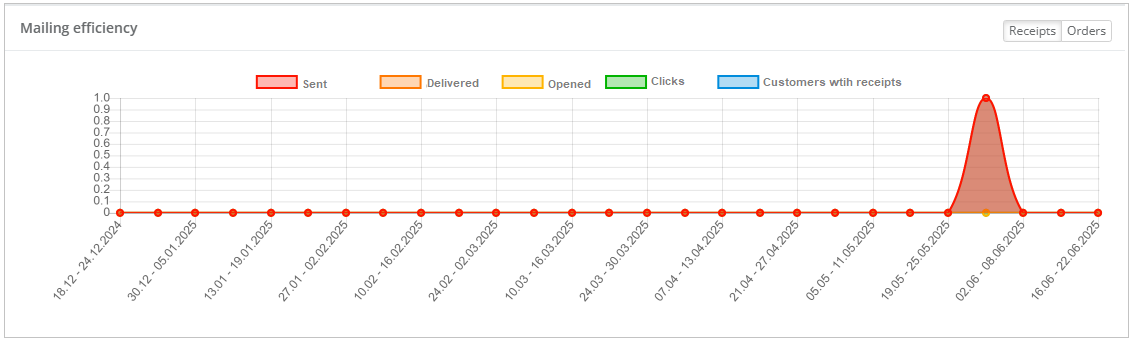 |
Point the mouse to the chart data point to see the exact data for a specific day. Information about the mailing efficiency is displayed in the form of a funnel, showing the percentage of customers transitioning between stages. For example:
|
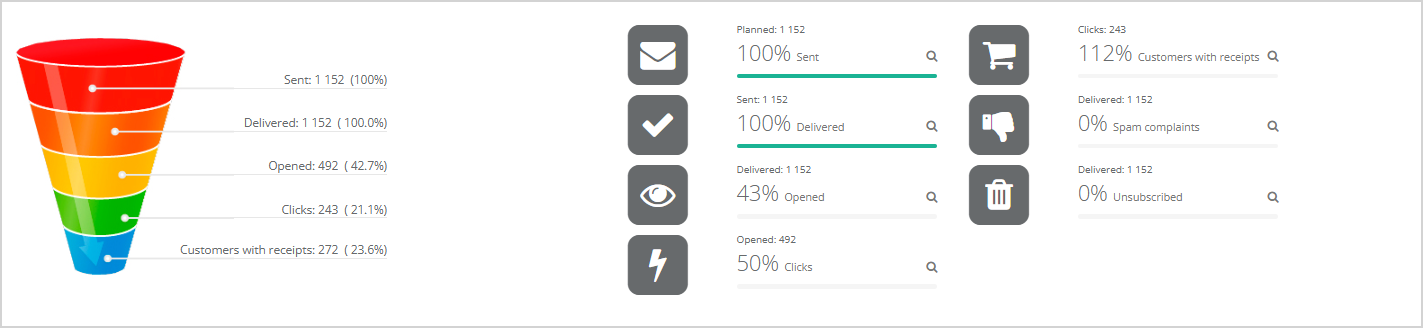 |
On the right side, the report shows the percentage of customers who transitioned to the next stage. For example:
- 50% of those who opened the email clicked on a link.
You can also see the percentage of recipients who marked the email as spam or unsubscribed from mailing.
You can click on the magnifying glass icon to view a list of all customers at each stage, as well as the metrics for this segment. Numerical value of each criterion and percentage of the total number, or deviation from the average value, will be shown. For more information on viewing customer lists, see here.
When viewing a customer list, there is an option to export data into a file  . You can export information by:
- customers;
- receipts;
- receipt lines;
- orders;
- order lines;
- target audiences.
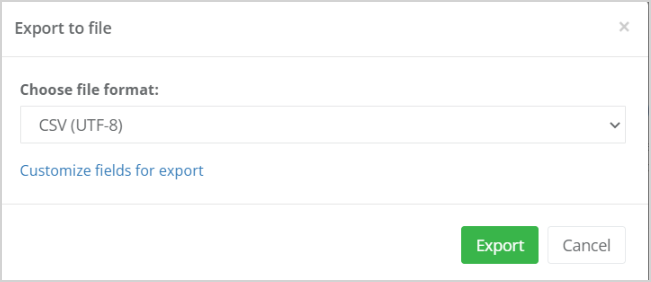
By clicking on the desired option, there opens the Export to file window. For detailed information about file formats and configuration of fields for export, please refer to this section.
 |
Product Sales
This report shows the top 25 product categories in receipts/orders associated with this mailing. For each product category, you can view:
- Sales by category, items — how many products were purchased in this category;
- Sales by category, EUR — the total sales value in this category;
- Number of receipts/orders per category — how many receipts/orders included items from this category.
The Product Sales table supports column sorting (click the column header) and searching by category name.
When pointing the mouse to a sector in the pie chart, the corresponding product category name and numerical value are displayed. For example, if the table is sorted by the Number of receipts per category column, the chart sector will display the number of receipts in that category.
You can generate the top 25 categories using three different methods:
- By the number of sold products in the category. For example, most purchased products were nails (600 boxes) and wallpaper (400 rolls).
- By the total cost of sold products in the category. For instance, drills generated EUR 45,000 in sales, while screwdrivers generated EUR 32,000.
- By the frequency the item appeared in a receipt. For example, 300 receipts included nails and 250 included screwdrivers.
By default, the table is sorted by the first column, and the top 25 is generated based on the number of sold products. To generate the top 25 by sales value, sort the data by the second column.
If the mailing includes a control group or A/B testing, you can view the top 25 within each group.
- If multiple message versions were sent using A/B testing, you can analyze how each message version affected the product sales.
- If a control group was created, you can compare sales between those who received the mailing and those who did not.
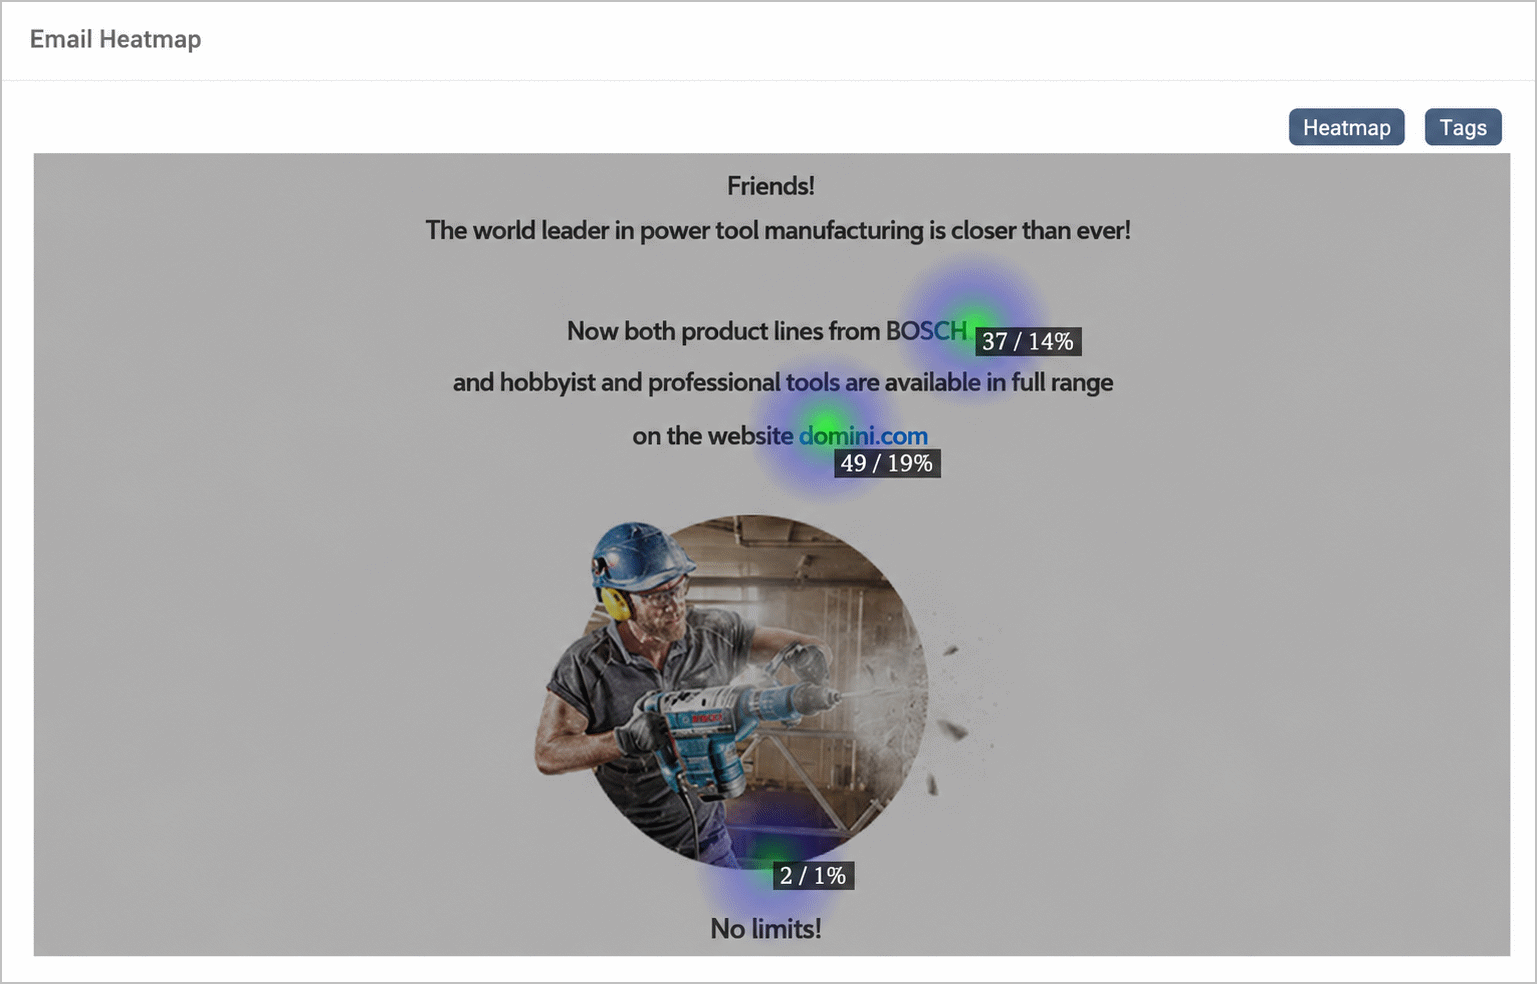
Heatmap
The Click Heatmap report provides the following information:
- How many times customers clicked on links in the email;
- Percentage of customers who read the email and clicked on a link.
The Heatmap and Tags buttons allow to customize the report's appearance:
- The Heatmap button turns on/off the heatmap display. It is enabled by default.
- Clicking the Tags button results in tags to appear when pointing to a link.
|
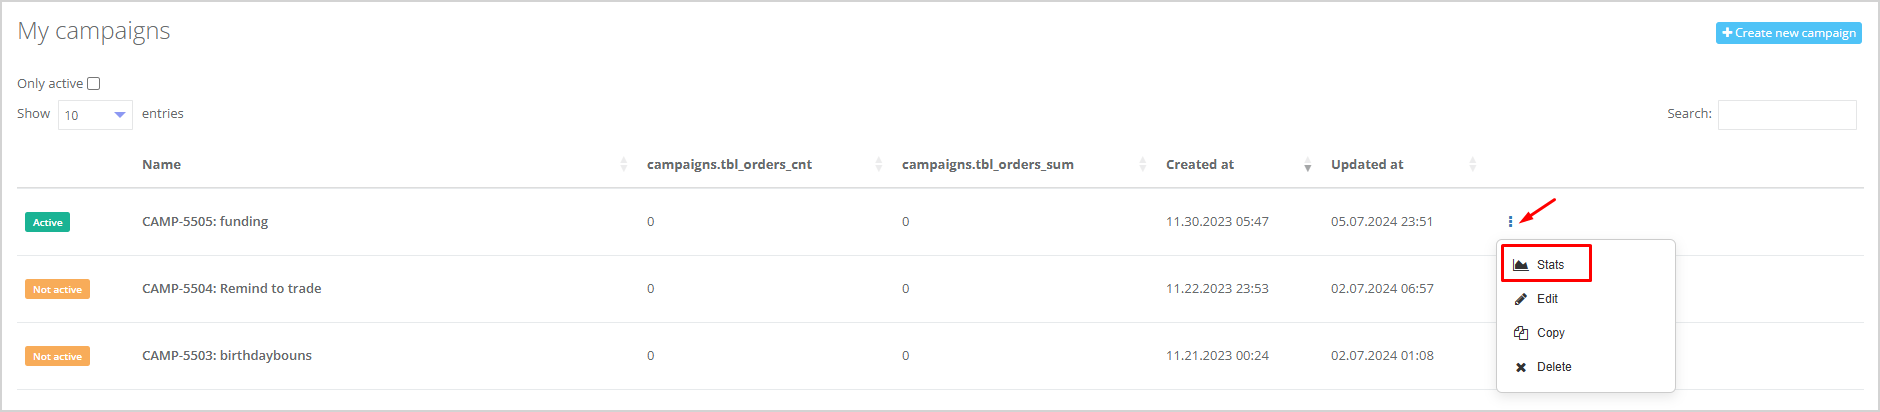
Mailing report within a campaign
When an email/SMS/push mailing is sent within a campaign, you can also view a report for such mailing. To do so, open the Campaigns section in the left navigation menu. In the opened campaign list, select the desired campaign and click the Stats button.
 |
Details about the campaign report can be found in a separate article.